What is Delta-hedging?
Options market makers (or dealers) sit at the center of the S&P 500 options market, facilitating the vast majority of trades. The dealer sells what you buy, and vice versa.
Taking the other side means the dealer carries directional risk he doesn’t want to own. If you buy a call and the market rallies, the dealer who sold it to you loses money. To avoid that, dealers continuously hedge their exposure in the underlying, primarily through S&P 500 futures or other derivatives. This practice is called delta-hedging.
Delta measures how much an option’s price moves for a given move in the underlying. A call with a delta of 0.50 gains $0.50 for every $1 the SPX rises. A dealer short that call must hold approximately 0.5 units of the underlying to stay delta-neutral. As the market moves, delta shifts, and the dealer must continuously rebalance. This rebalancing is not a choice; it is the mechanical requirement of running a delta-neutral book.How large are these flows? The numbers are substantial: SPX volume jumped from only $30 bln/month starting 2020, to now over $100 bln. On an average day, roughly 70% of SPX options volume involves a customer on one side and a market maker on the other, and dealers have to move billions in dollars for every 1% move in the market daily.
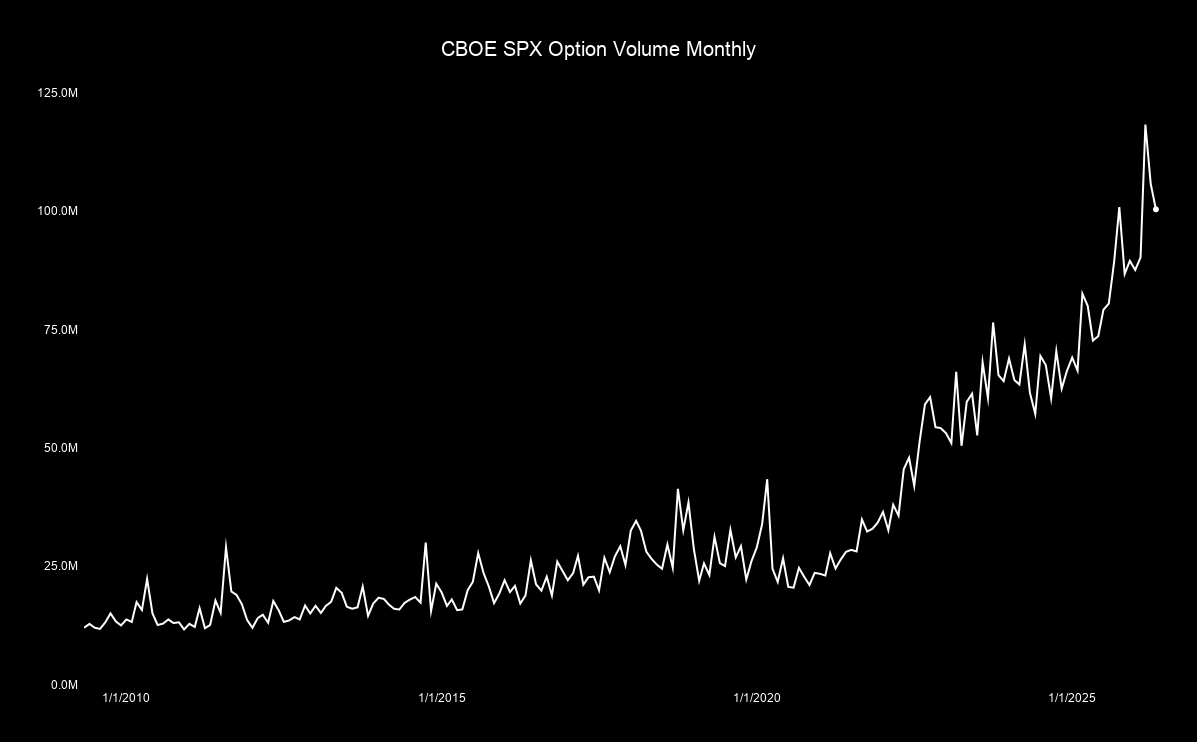
Dealers are not just niche players in this market - they are the market, and their aggregate position is not balanced, but end up net short puts and long calls, as investors by and large use the SPX option complex to buy downside protection and sell calls for funding.
The result is a market structure with predictable delta-hedging flows.
Concrete examples
Let’s discuss two separate trades, and suppose the SPX is at 5,000.
In the first scenario, the dealer buys a call from an investor with a strike of 5,050 and a delta of 0.40. The dealer is now long that delta and needs to hedge his directional risk by selling 0.40 units of the underlying (the initial hedge). The position is delta-neutral, but only for a moment.
Assume the market moves up to 5,100. As the index rises and the strike gets closer, the call’s delta increases, say to 0.60. The dealer now must sell even more of the underlying to stay hedged. The size of this secondary hedge depends on the gamma of the option (the rate of change in delta) - if gamma is large, the hedge needs to be bigger.
Now imagine the market reverses and falls back to 4,950. The call gets further out of the money and its delta drops to 0.25, which means the dealer has to buy back part of his short hedge.
→ Key take-away: Both trades - the sell order in a rising, and the buy order in a falling market - increase liquidity by compressing the spread, which decreases volatility.
In the second scenario, the dealer sells a put to a client with a strike of 4,950 and a delta of 0.35. To hedge, the dealer sells 0.35 units of the underlying initially.
Assume the market falls to 4,900, and as the short put goes deeper in the money, its delta increases, say to 0.60, which requires the dealer to sell more of the underlying to stay hedged.
Now the opposite price trend: The market rises to 5,100, and as the short call goes deeper in the money, its delta increases, say to 0.60, which requires the dealer to buy more of the underlying to stay hedged.
→ Key take-away: Both trades - the sell order in a falling, and the buy order in a rising market - decrease liquidity by increasing the spread, which increases volatility.
Putting both trades together
Let’s combine both isolated scenarios and consider the simplified, but realistic situation where the dealer is long one call and short one put. Now the direction of the hedge depends on whether the aggregate dealer position is long or short gamma.
A long call has a positive bell-shaped gamma curve, a short put has a negative bell curve, and by stitching both curves together via a simulation run, we can tell exactly where gamma “flips” from long to short or vice versa. This is called the “gamma flip.”
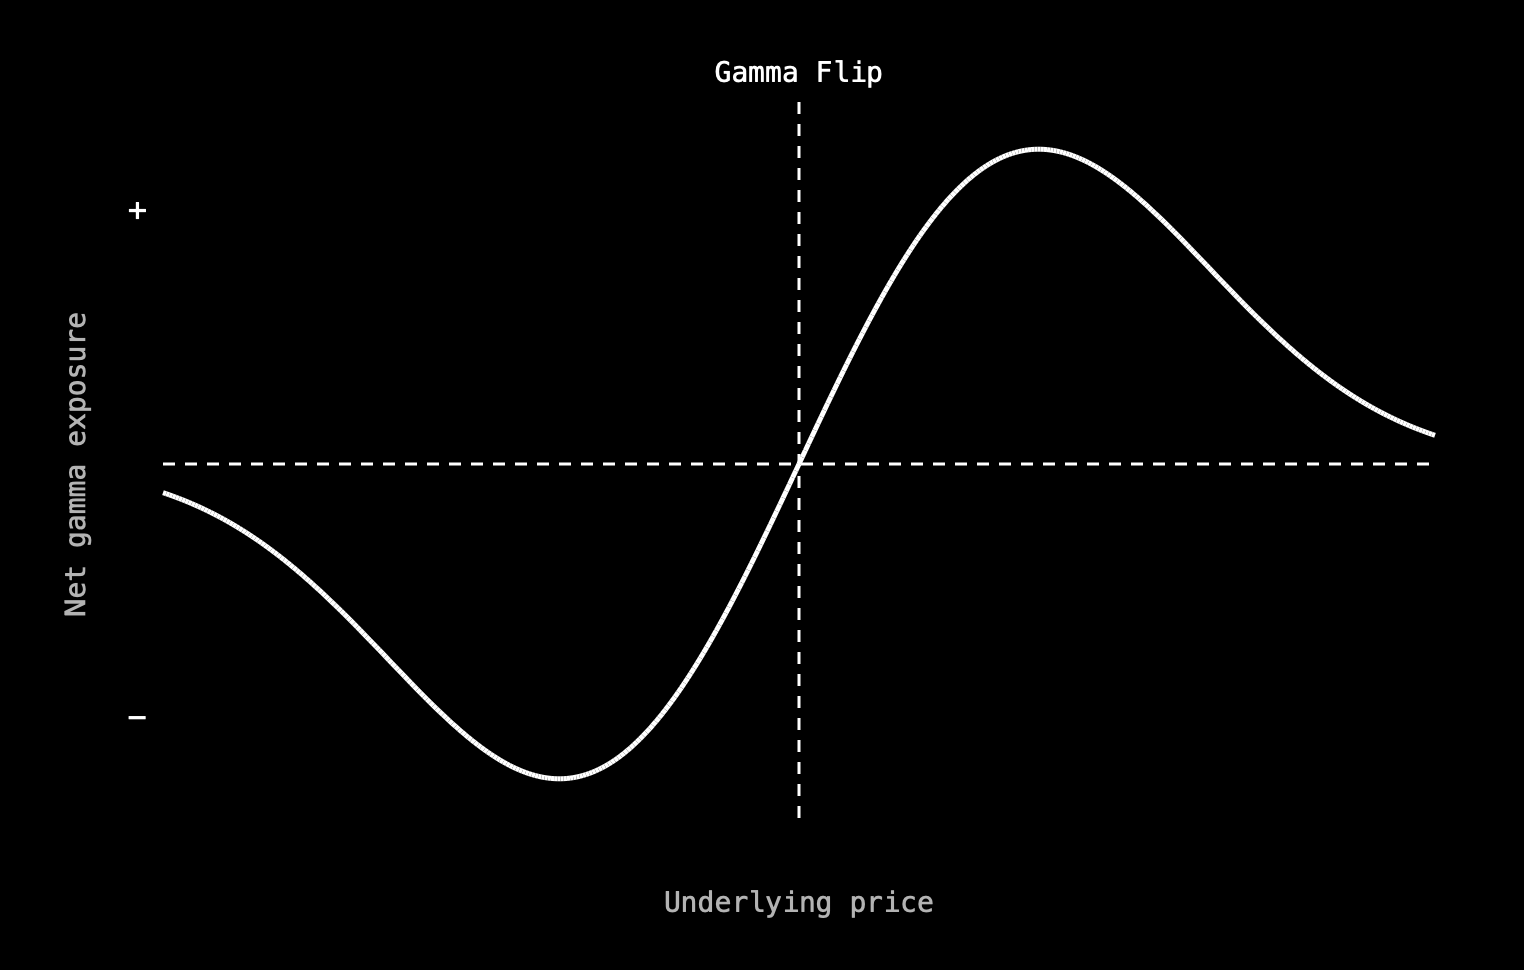
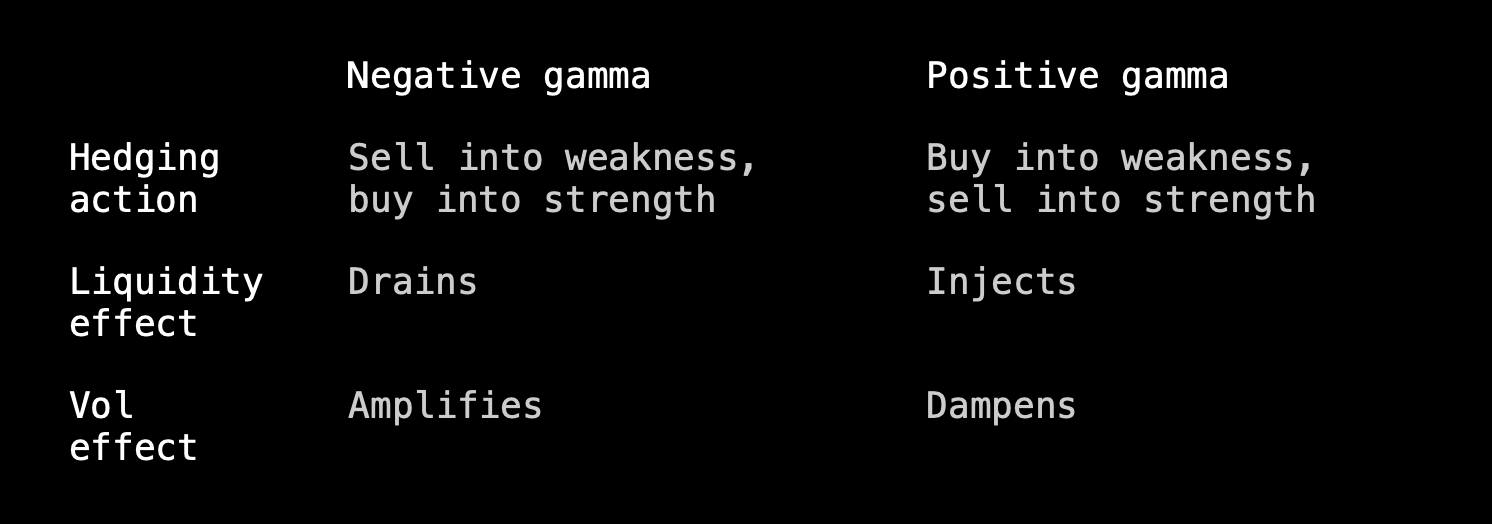
The sign of dealers’ aggregate gamma position determines whether their hedging activity stabilizes or destabilizes the market. When gamma flips negative, dealers become liquidity takers through the mechanics explained above; when gamma flips positive, dealers are shock absorbers, constantly injecting liquidity. The volatility environment is not just a function of macro news or sentiment. It is in large parts a function of where dealers sit in their gamma exposure.
Below is a simple overview that helps you visualize the effect.
Secondary effects: “Shadow Gamma”
Most discussions of dealer hedging focus on the effect on the underlying. But there is a second channel that receives far less attention: dealer inventory risk directly shapes the prices of options themselves, because the neat delta-hedging approach described above runs into a significant problem in practice.
There are hours when continuous hedging is not possible. Overnight and over weekends, equity and futures markets are either closed or too thin to absorb the required trades.
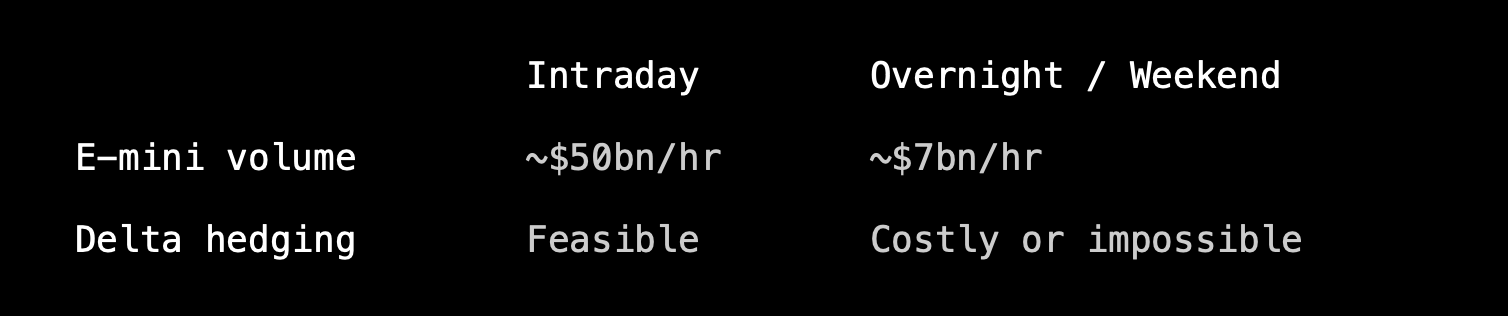
A 10% overnight decline in the S&P 500 could generate losses that exceed dealers’ option inventory value if deltas cannot be rebalanced. Closing that exposure would require equity sales of up to $8 billion, far exceeding typical overnight E-mini turnover of well below $1 billion per hour.
So overnight, dealers run into big liquidity constraints, and thus carry unhedgeable equity market risk across every night and weekend their positions remain open. To accept that risk, they demand compensation in the form of higher option prices. This is called “shadow gamma.”
The effect is mostly concentrated in out-of-the-money puts, where dealers’ short inventory is deepest and their downside exposure is greatest.
The practical implication is that SPX option prices are not set purely by supply, demand, and volatility expectations. They reflect the cost of carrying unhedgeable overnight inventory risk. When that risk is high, options are expensive. When liquidity improves and dealers can hedge more continuously, option risk premia compress.
Implied volatility is not always a pure forecast of realized volatility but like the underlying itself influenced by mechanical requirements.
A note on 0DTE options
This primer has focused on the broader SPX options complex. Zero-days-to-expiration options represent now roughly 60% of the traded option volume and introduce their own dynamics, and are set aside here intentionally to focus in on them in a follow-up in which we will look at some findings that may challenge a few commonly held assumptions about how those options affect the market.
This is a post from GammaLab — real-time market intelligence powered by AI. Log in or subscribe to access the full platform.