CTA flows
Where trend-followers are positioned, and the levels that force them to trade.
CTAs are the largest systematic, rules-based buyers and sellers in futures markets, and because the rules are public knowledge, their behaviour can be modelled. They do not decide; they follow a trend signal. If you know roughly where their signals sit, you know roughly where they have to trade.
What CTA flows are
Commodity Trading Advisors (managed-futures and trend-following funds) run momentum strategies across equity indices, rates, FX and commodities. Their exposure is a function of price trend and realised volatility, not of any view about value. When price crosses a medium-term trend threshold, the model flips, and the fund must reposition regardless of what the news says that morning.
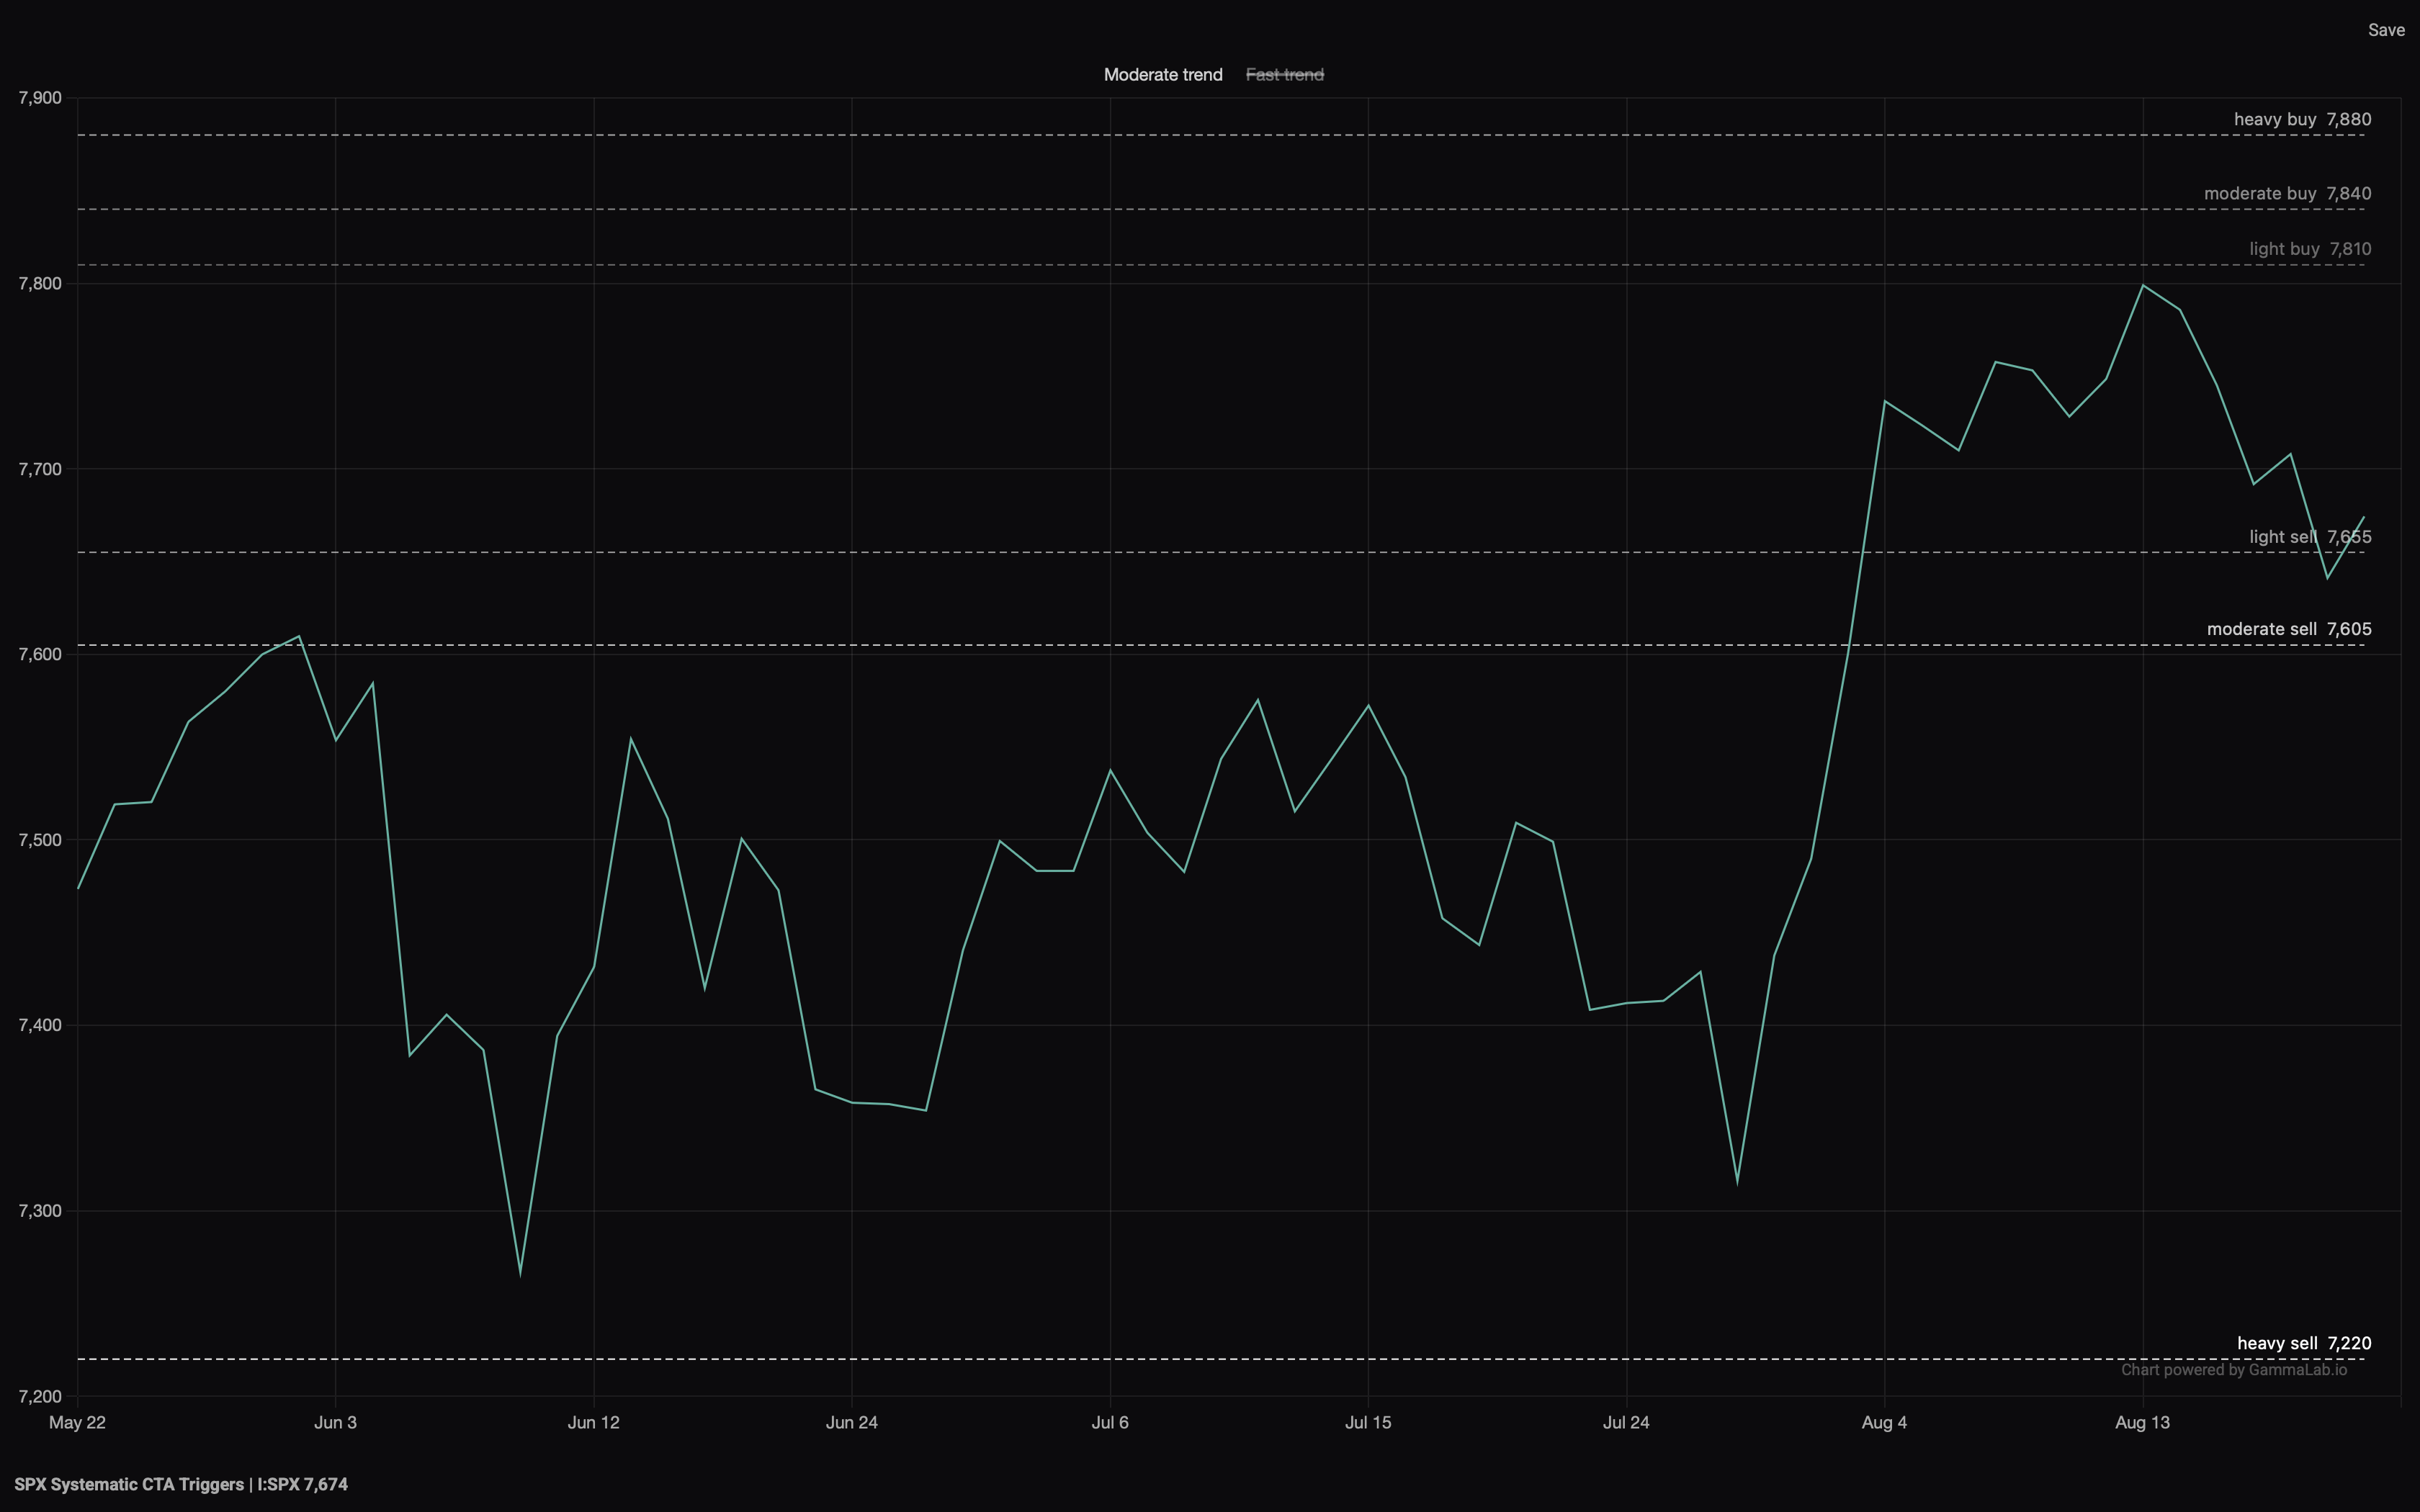
That produces two things a discretionary trader can use. First, a positioning estimate: are trend-followers long, short, or flat, and how stretched is it. Second, and more useful, trigger levels: the prices at which a meaningful cohort of them switches from buying to selling.
What GammaLab shows
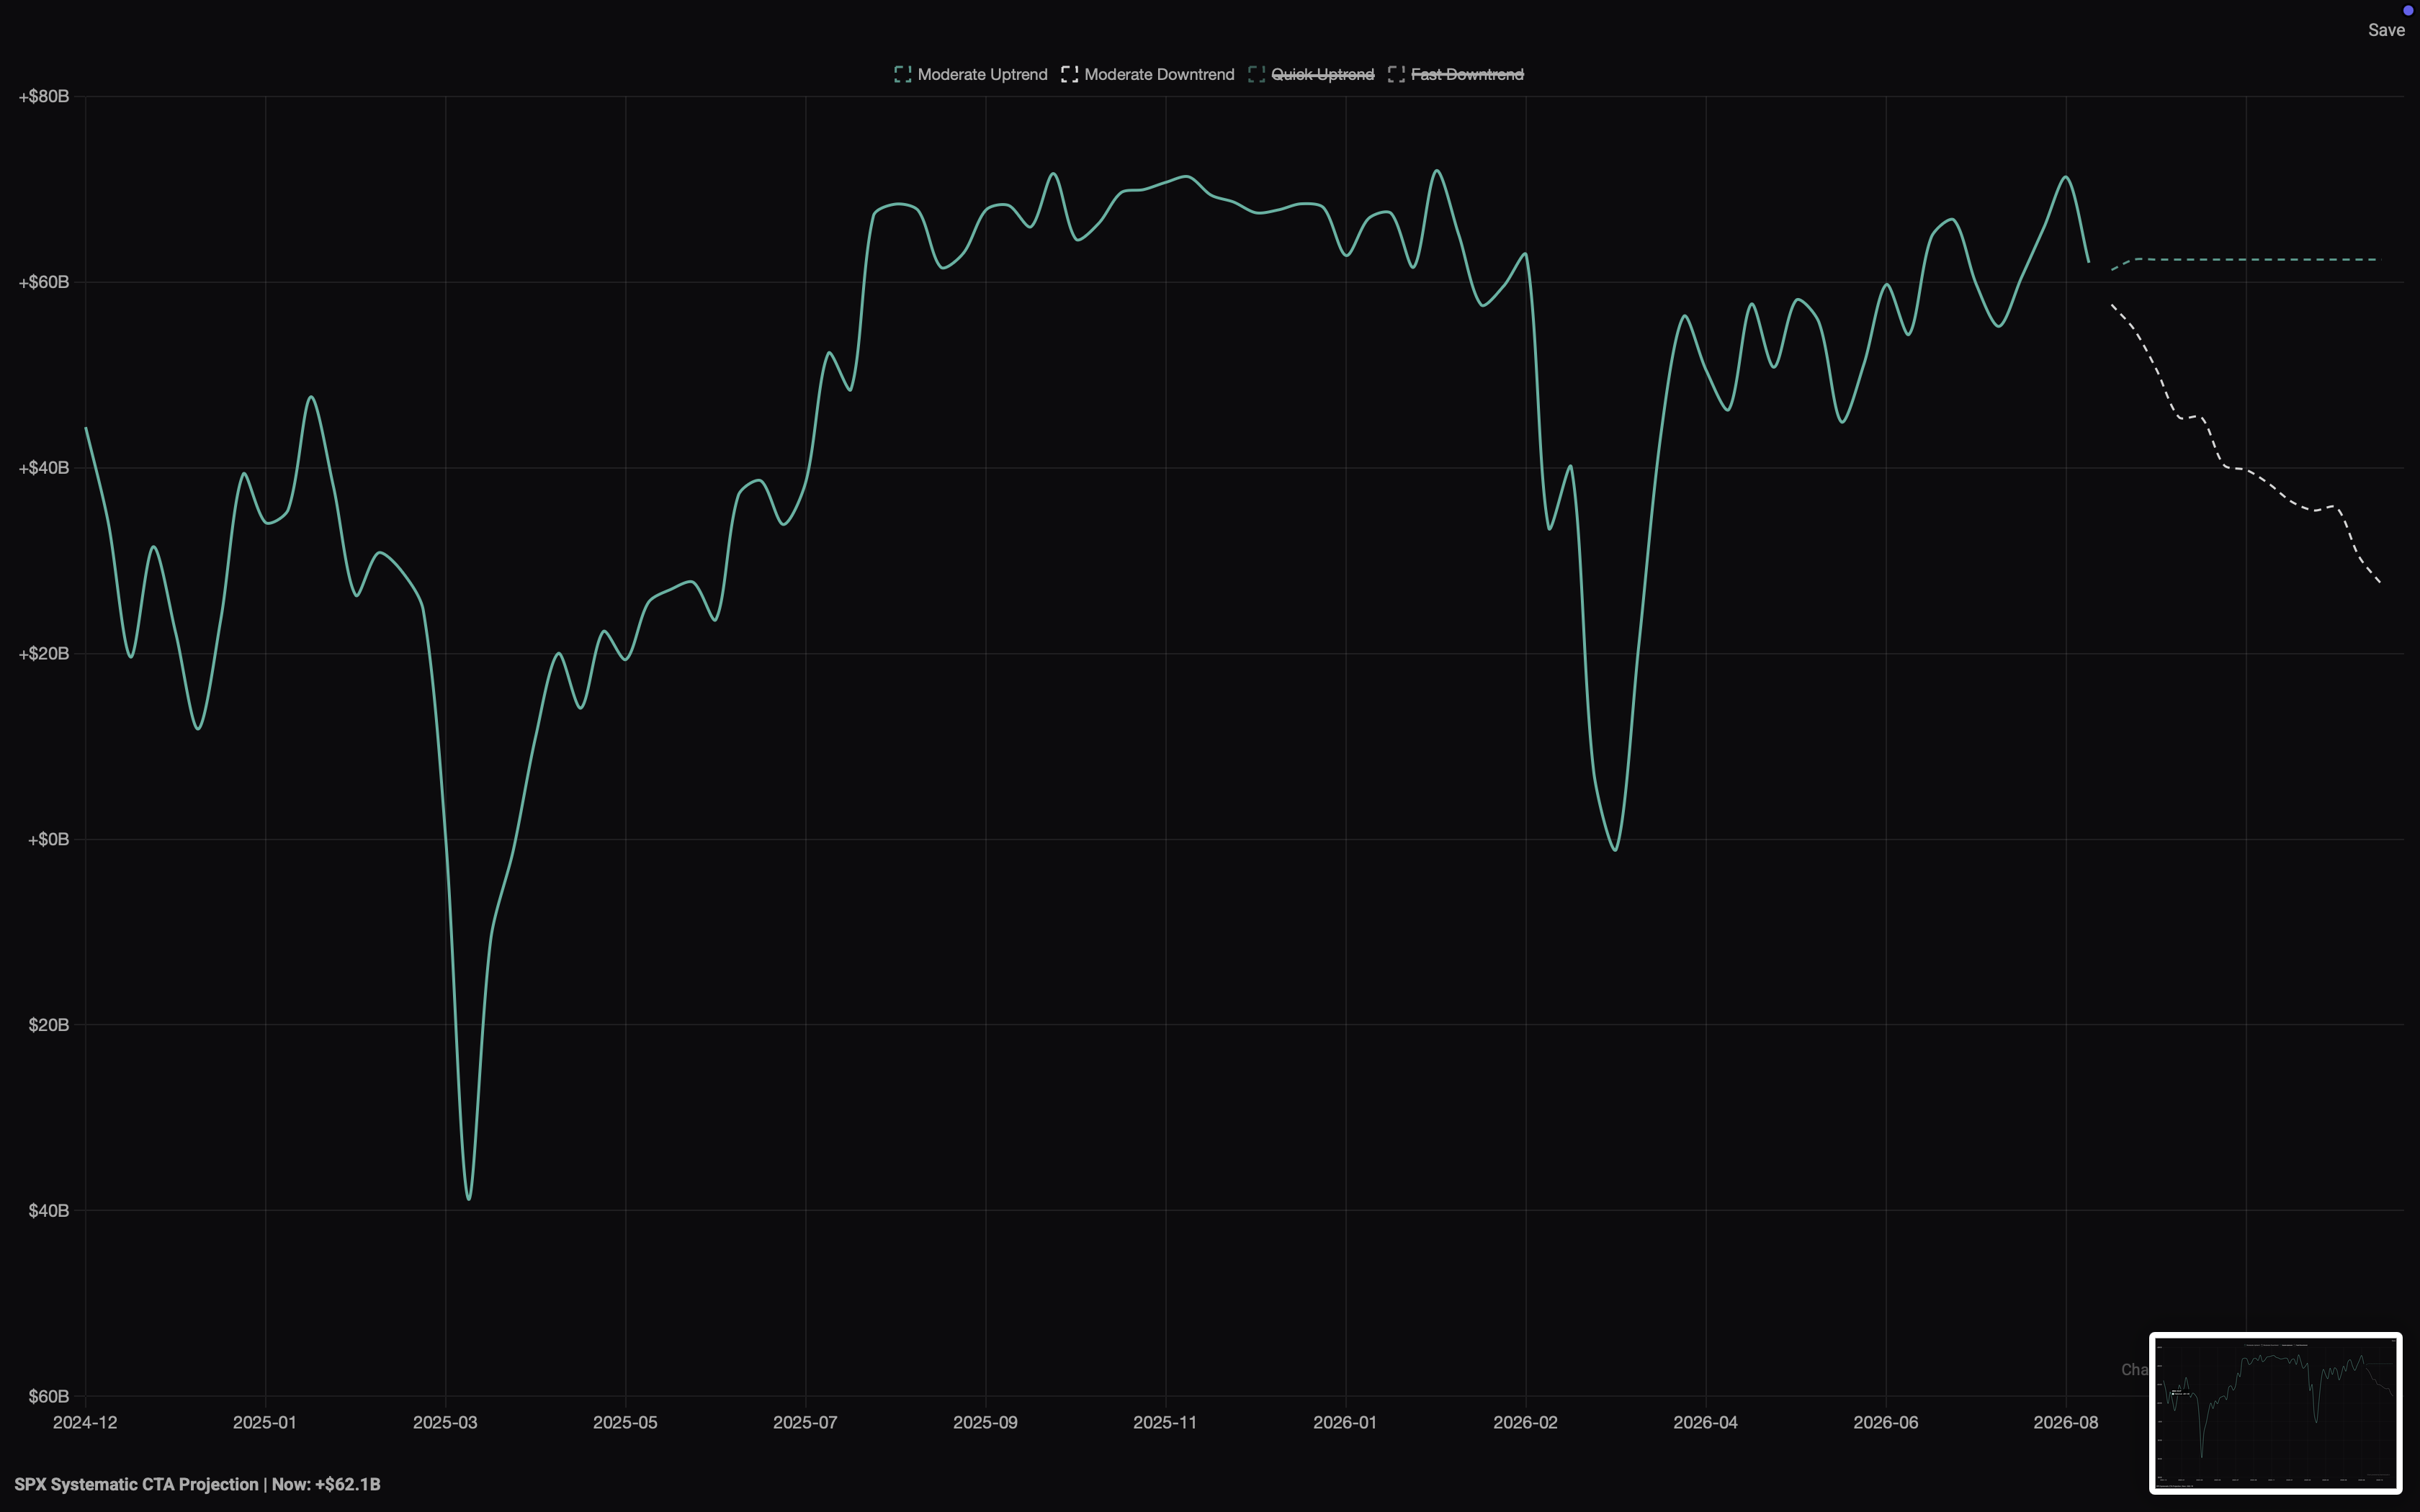
- Estimated CTA exposure per market, tracked over time rather than as a one-off number.
- Trigger levels: the prices where the modelled signal flips, and how far away they currently sit.
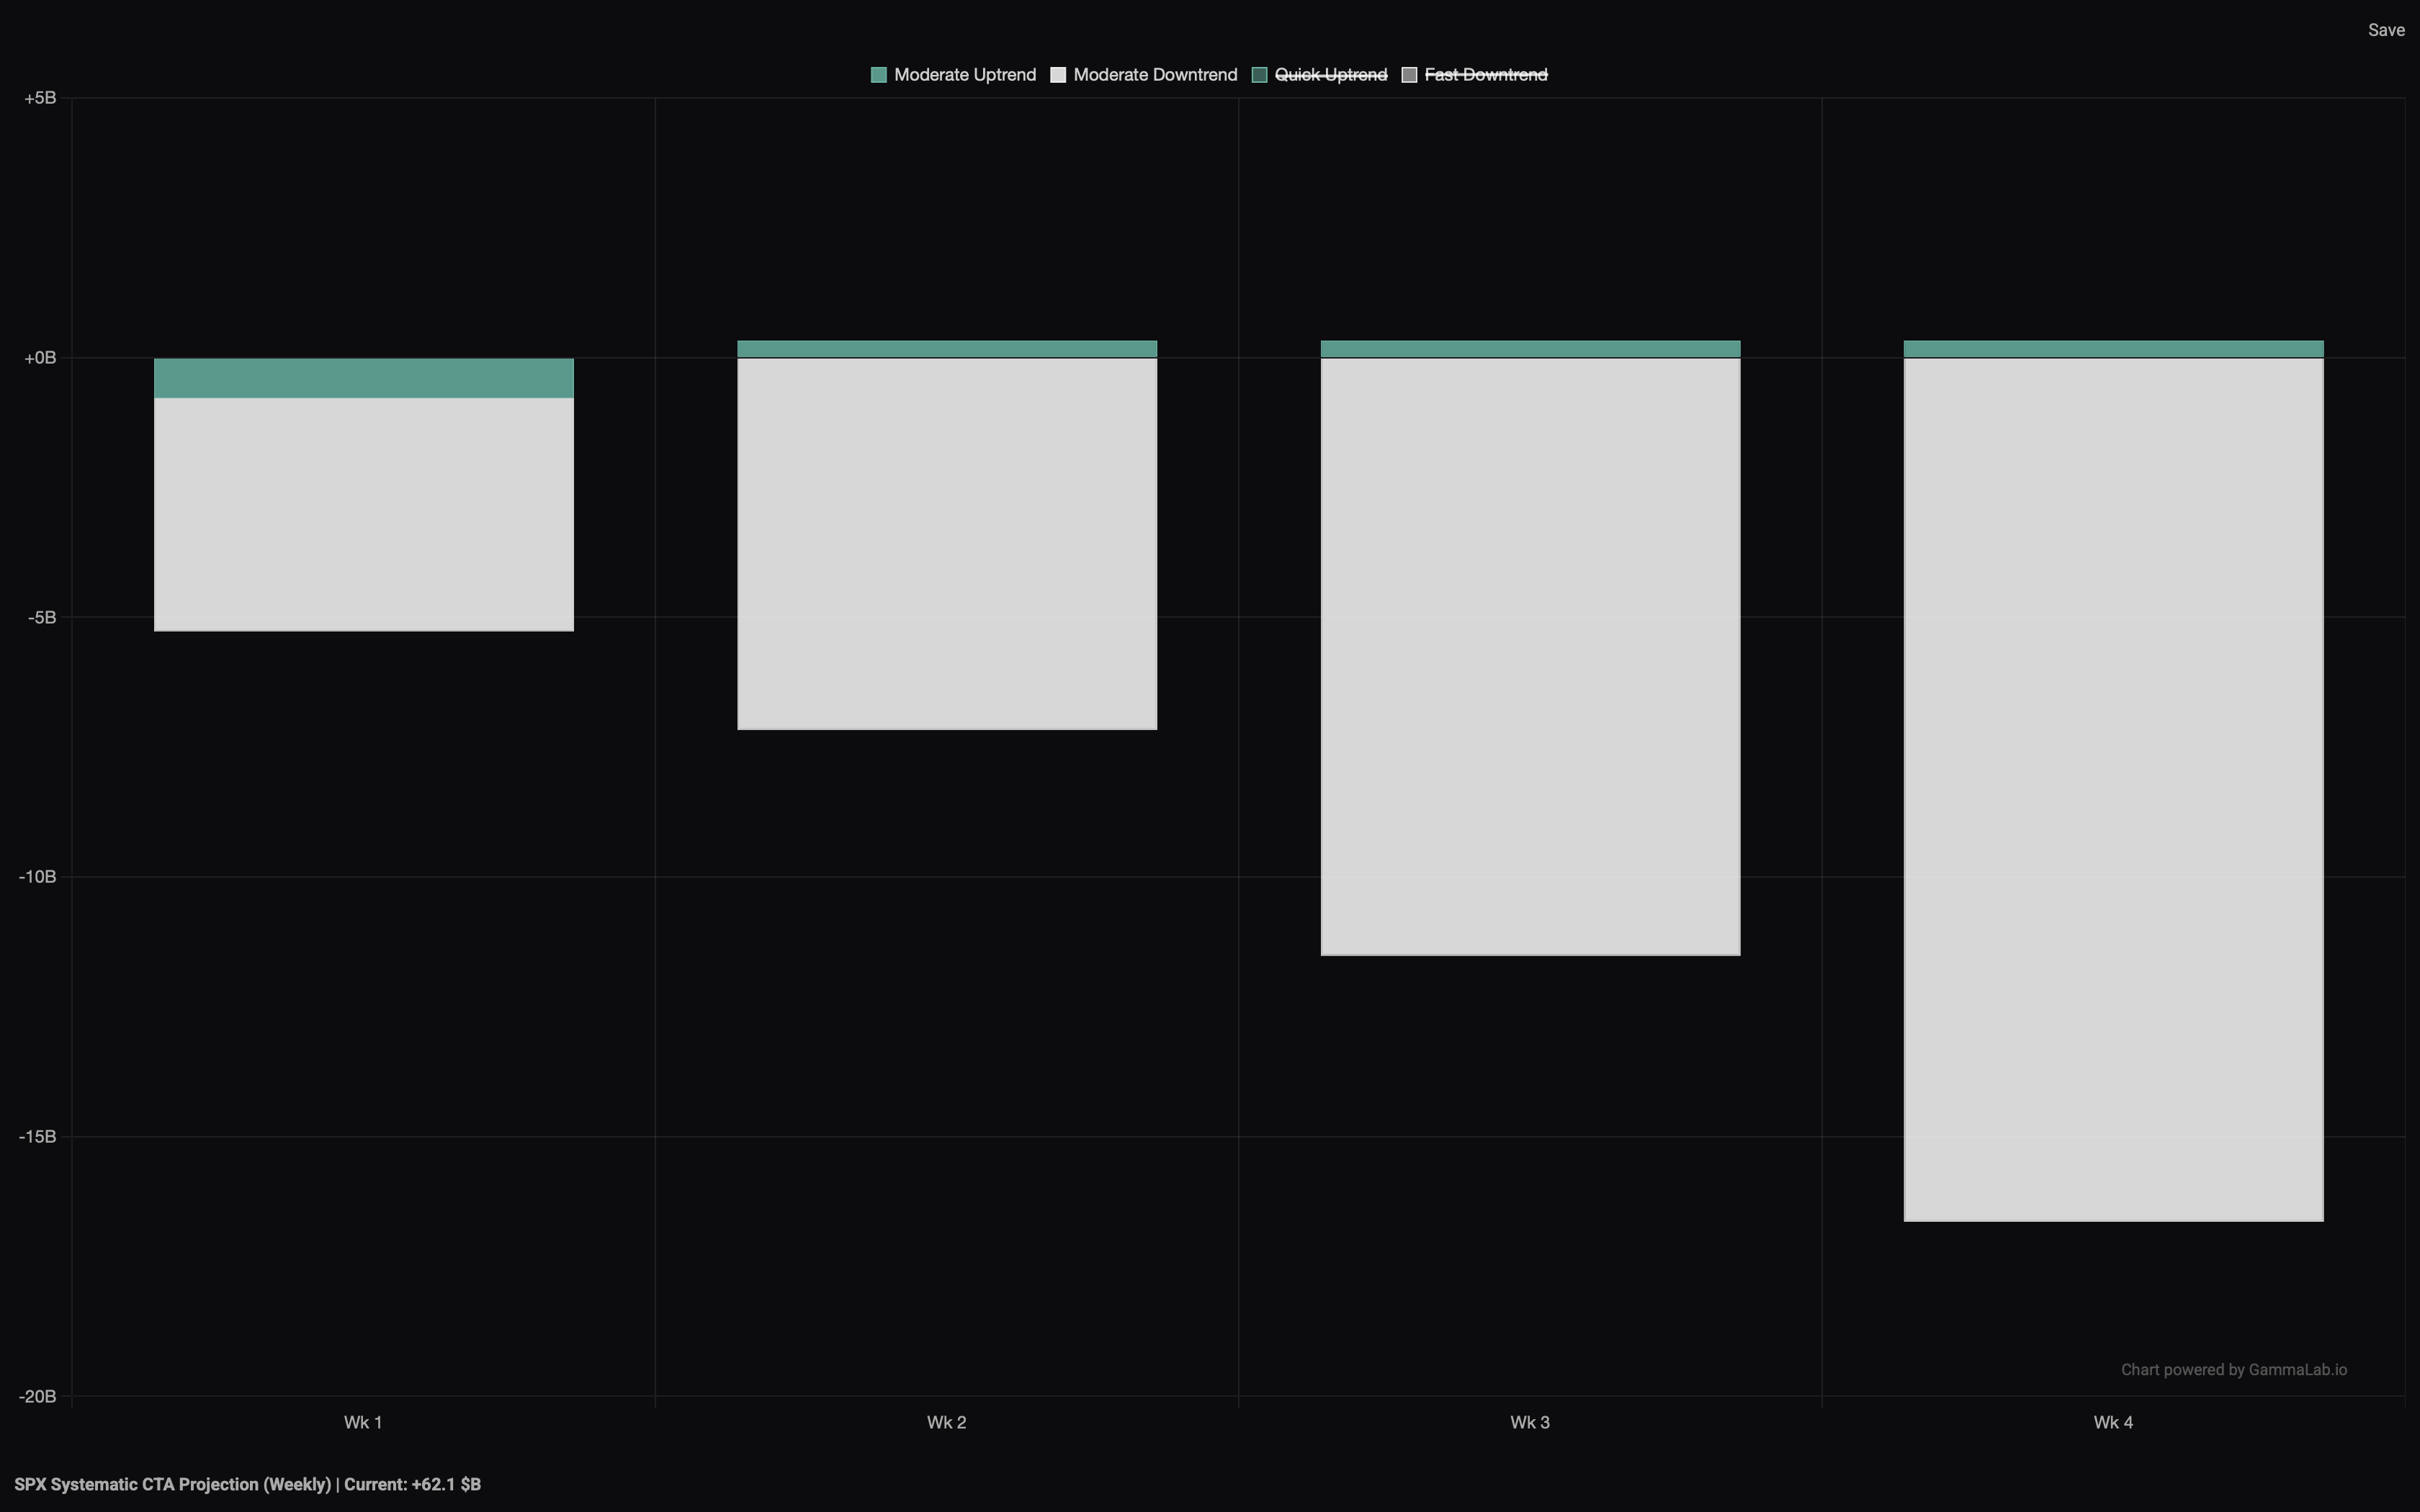
- Projected flow size: roughly how much has to change hands if a level breaks, so you can tell a nuisance from a genuine air pocket.
- Positioning history: how today's estimate compares with recent weeks, which is where the interesting extremes show up.
What a model is and isn't
Nobody outside the funds knows their exact books, and any product claiming otherwise is selling you a guess dressed up as data. GammaLab's CTA figures are a model: a reconstruction of the standard trend signals applied to real price and volatility history. It is useful because the underlying strategies are genuinely similar to one another and genuinely mechanical, not because it has inside information. We label it as a model everywhere it appears, and we would rather you treated it as a well-founded estimate than as fact.
How traders use it
The classic use is the air pocket. When price is grinding toward a level where a large cohort of trend-followers flips from long to short, and there is little natural liquidity beneath it, the break tends to be faster and further than the news that triggered it would justify. Knowing that level in advance changes how you size and where you place stops.
Stretched positioning matters too: a market where trend-followers are already at maximum long has lost a buyer, and rallies from there rely on someone else. Read alongside vol control flows (the other big systematic cohort), you get a reasonable picture of how much of the tape is being driven by rules rather than by opinion.